Overview
What is Biodiverse?
Biodiverse is a free tool for the spatial analysis of diversity using indices based on taxonomic, phylogenetic, matrix and trait-based relationships. Analyses can be run on a wide range of variables that vary across space and/or time, whether they are biological (e.g., diversity distributions of marsupials across Australia), physical (e.g., variation in rainfall across continental US), or other systems (e.g., geographic and temporal distribution of various Mediterranean dialects).
What analyses can I do with Biodiverse?
You can run a range of spatial analyses, such as cluster, moving window and randomisation analyses, visualise analysis results in interactive diagrams and maps, and optionally export analysis results to a variety of formats (e.g. delimited text, geoTIFF, JSON) to third party software for further analysis, such as ESRI ArcGIS, R and Matlab.
What programming language is Biodiverse developed in?
Biodiverse is written in the Perl programming language. There are two parts: an analysis engine, which can be scripted using perl code, and a GUI which is developed using Gtk3 and which calls the analytical engine.
Which operating systems does Biodiverse support?
You can install and run binary and source code versions of Biodiverse on Windows, MacOS and Linux platforms. The analysis engine is also tested on the FreeBSD OS and source code installations can be used on that platform. Visit the Biodiverse Downloads page to obtain the version of Biodiverse you wish to install.
How do I install Biodiverse?
Follow the Installation instructions webpage for your selected version.
Using this guide
Where can I get additional help?
You can access a range of Biodiverse Help Topics by clicking on the Help option on the menu bar within the Biodiverse application (see image below). You can also hover the mouse pointer over most buttons and menu items in Biodiverse to view their associated tooltips.
This guide does not cover all the detailed aspects of Biodiverse functionality, so links to the online Biodiverse documentation covering more detailed information are provided throughout. Alternatively, visit the Biodiverse Project Home for more extensive software documentation.
You can also send questions to the Biodiverse discussion forum at https://github.com/shawnlaffan/biodiverse/discussions or at https://groups.google.com/forum/#!forum/biodiverse-users. We welcome any queries, comments or feedback. 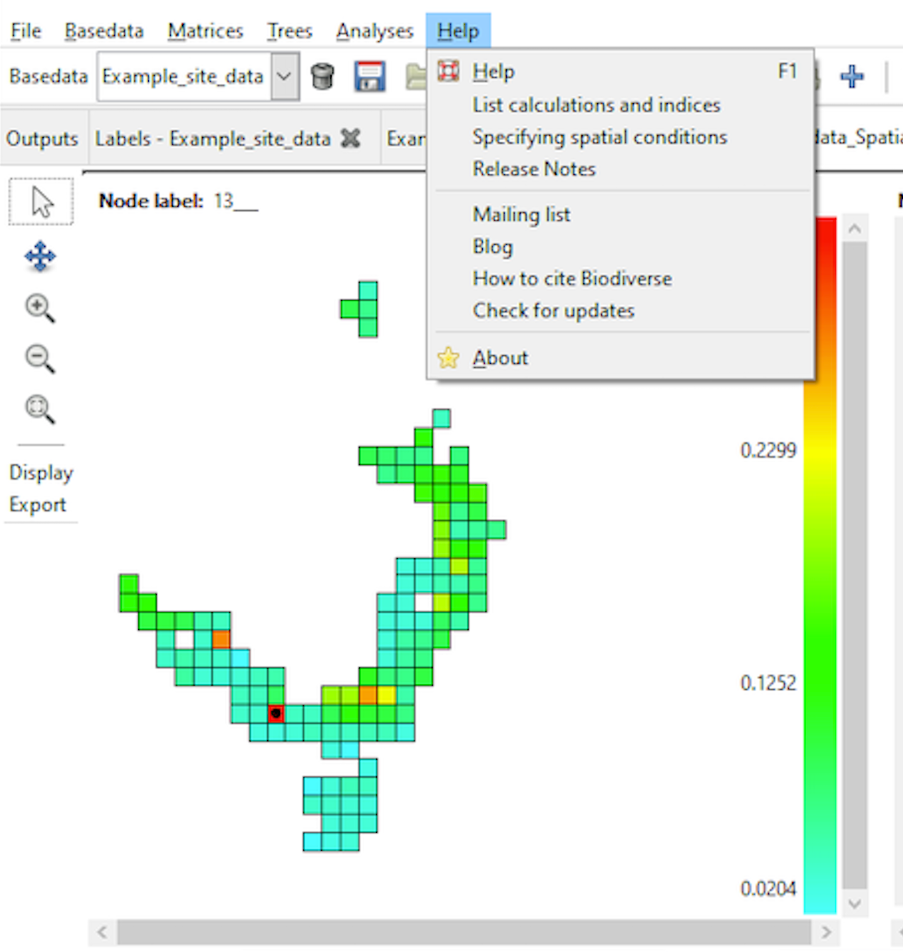
Some key terminology
The two concepts below are important when using Biodiverse. For details of a fuller list of Biodiverse terminology, see the Data Structures page.
Labels
Typically labels represent species, but in reality they can be any named entity that is then aggregated, or ‘binned’, into a Group. Hence, an individual label could also represent other taxonomic levels, e.g. a genus, or distinct entities from other phenomena, such as lithological classes (e.g. different rock types) or linguistic structures (e.g. different phonemes).
Groups
Groups are cells into which the labels are aggregated (binned). These are usually square, but can represent any number of axes (x, y, z, time, population-ID, …) with differing cell sizes (resolutions) and numeric or text types. The groups are plotted in the interactive maps that Biodiverse produces as outputs of data visualisation and spatial analyses, as in the example below. Groups are also integral to the spatial components of the moving window, cluster and randomisation analyses.
Please note that group coordinates are mapped using the coordinate system (map projection) of the input data. If you have input data in multiple files, with differing coordinate systems, then you can use GIS or other geospatial tools, such as the sf library in R, to project them into a common system.
It is important to emphasise that while screenshots provided throughout this guide show spatial analysis of the Australian mainland/east coast, Biodiverse is applicable across infinite scales and spatial domains. In our example data case, the software supports geographic coordinates; however, Biodiverse can use any coordinate system.
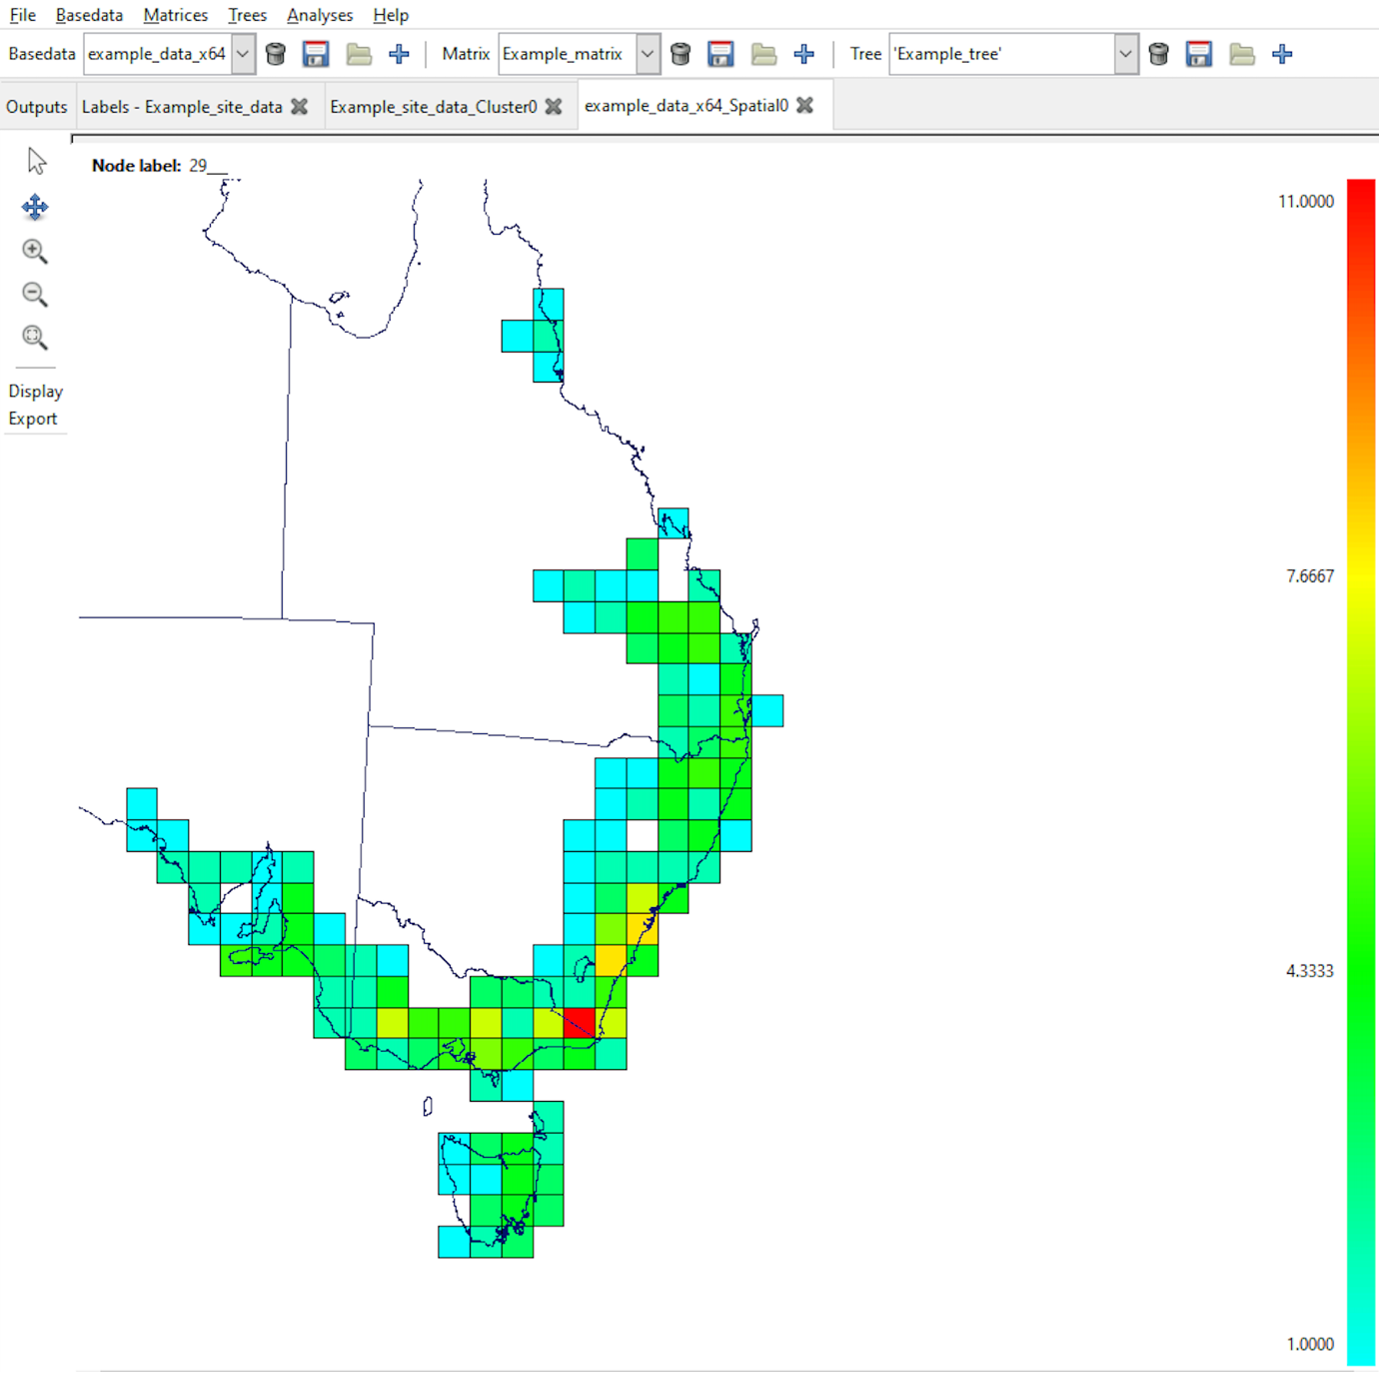
The ‘Groups’ are the square cells representing the Australian mainland.